WordPress Performance Optimization Through CDN, Caching, and Image Compression
Discover how to diagnose and fix what’s really slowing your WordPress site. Learn pro tips on caching, CDNs, and image optimization to boost speed, stability, and Core Web Vitals – fast.
Table of Contents
Key Takeaways
- Test before you tweak. Run PageSpeed Insights first – it shows what actually slows your site, so you’re fixing facts, not guesses.
- Use caching to cut server strain. A caching layer stores ready-to-serve pages, so that your site stays fast through traffic spikes.
- Prioritize field data over lab scores. Lighthouse results simulate performance, but Core Web Vitals measure what real users experience – that’s what Google actually ranks.
- Optimize images efficiently. Use WebP format and lazy-load below-the-fold content to reduce load times without losing visual quality.
- Audit your plugins regularly. Deactivate or remove unused plugins. A single heavy plugin can undo other performance gains.
When your WordPress site crawls after a migration or crashes mid-campaign, it’s easy to point fingers at your host or pile on another plugin. But the truth is, without proper diagnosis, you’re probably fixing the wrong thing.
Google Search Console doesn’t sugar-coat it. Those Core Web Vitals warnings hit your rankings hard, and no plugin will save a 6MB hero image, strangling your Largest Contentful Paint. The real difference between a site that handles traffic surges and one that folds is rarely server speed – it’s knowing which bottleneck is doing the damage.
After 15+ years fine-tuning enterprise WordPress sites for millions of visitors, we’ve learned a simple truth: performance follows a pattern. Diagnose first. Apply the right fix. Then scale with confidence.
How to Find Out What's Slowing Your Site
Understand the Metrics Google Uses
Core Web Vitals are Google's official performance standards that directly influence your search rankings. Unlike vanity metrics, these three measurements reflect what your actual visitors experience:
LCP (Largest Contentful Paint) measures when your main content becomes visible. That hero image, headline, or featured video – whichever loads last – determines your LCP. Target under 2.5 seconds – anything slower frustrates users and triggers Google penalties.
CLS (Cumulative Layout Shift) tracks whether content jumps around during loading. If you’ve ever clicked a button only to hit an ad that suddenly appeared, that's a layout shift. Keep your score under 0.1 per CLS guidelines by reserving space for images and avoiding injected content above the fold.
INP (Interaction to Next Paint) replaced FID to measure how quickly your site responds to user interactions. Every click, tap, or keyboard input should trigger a visual response within 200ms per INP standards. Slow JavaScript execution is usually the culprit here.
You'll find these metrics in PageSpeed Insights for instant testing and Search Console's Core Web Vitals report for historical field data.
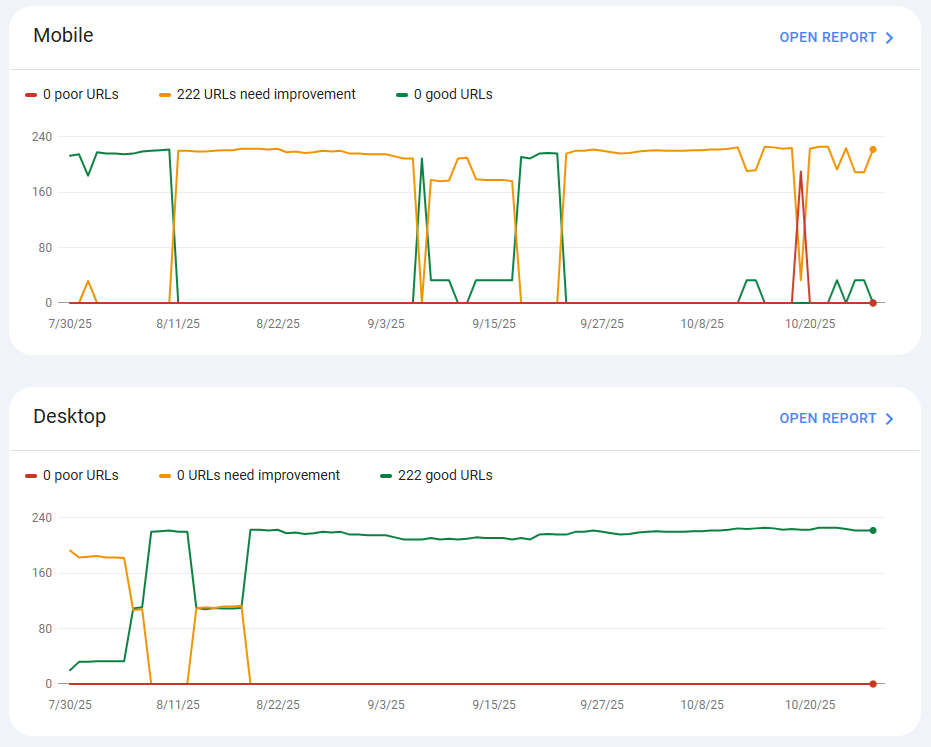
WordPress performance optimization with Google Search Console
How Do I Check WordPress Site Speed?
Start by running your site through PageSpeed Insights – it’s free and instantly shows what’s dragging your load time down.
Check the "Largest Contentful Paint element" section to spot the main culprit – often a bloated hero image or render-blocking JavaScript tanking your score.
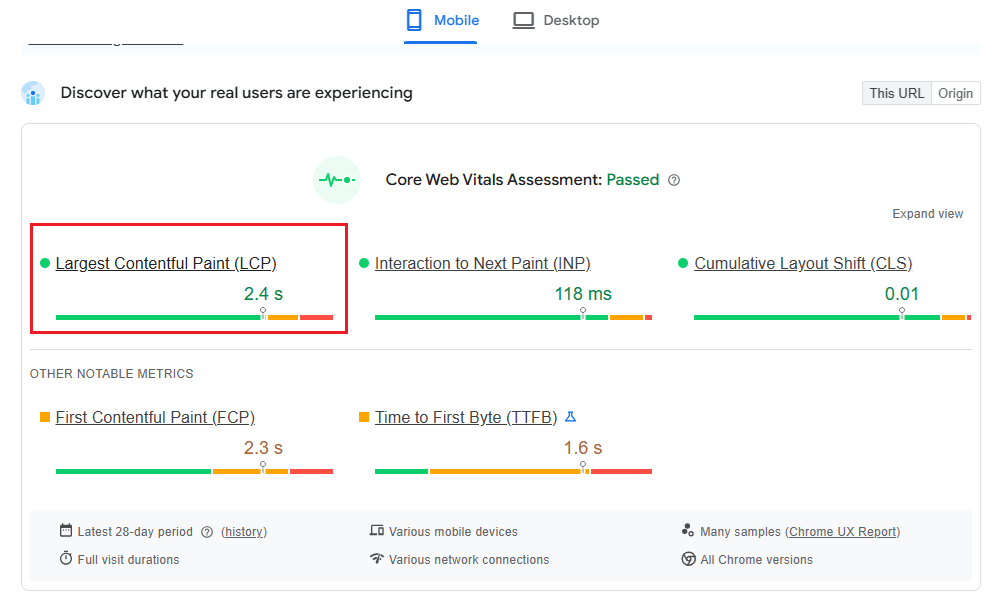
PageSpeed test for WordPress performance optimization
Then open the waterfall chart in your performance testing tool for a full play-by-play of your loading sequence:
- A long first bar (HTML document) = slow server response.
- Several long bars after = unoptimized assets.
- Parallel bars = solid HTTP/2 setup.
- Sequential bars = missed optimization wins.
If that first bar crawls past 5 seconds, fix your server response before touching images. And if you see a string of 2-second bars lining up one after another? Time to add lazy loading and compress your assets. This quick visual check saves hours chasing the wrong problems.
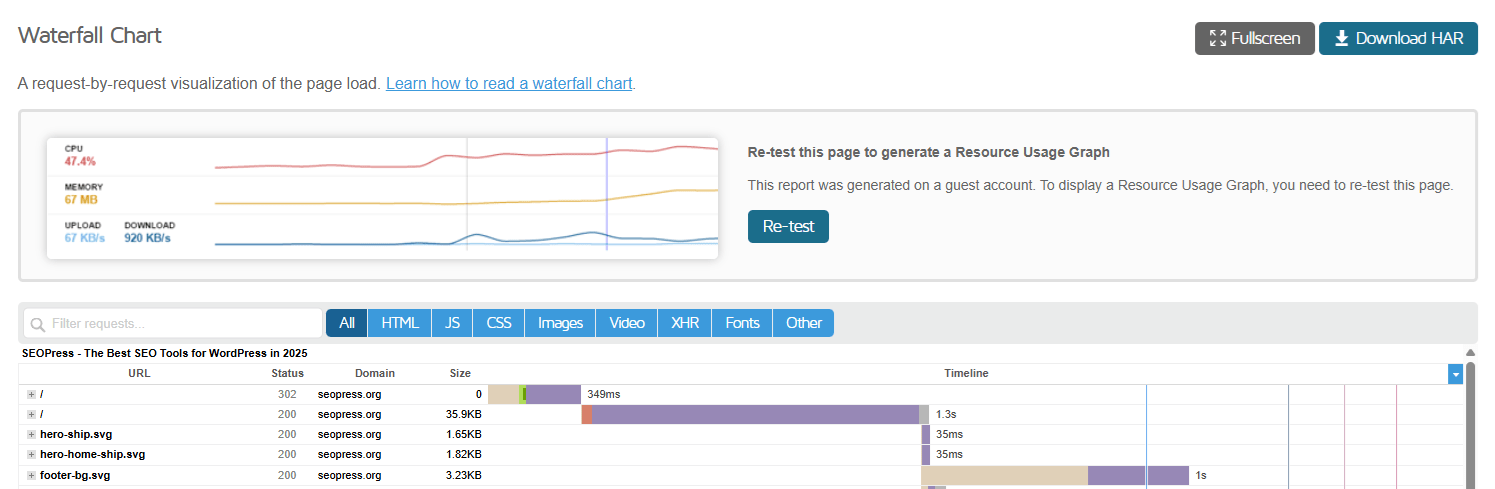
GTmetrix waterfall chart for WordPress performance optimization
Why Do I Pass Lighthouse But Fail Core Web Vitals?
Lighthouse tests your site in a bubble – one user, fast internet, perfect conditions. That shiny 95 score is based on Chrome DevTools running over your office Wi-Fi, not the real world.
CrUX looks at how actual visitors experience your site – like that shopper on 3G trying to check out on an old Android. And Google ranks you on CrUX’s field data, not your lab-perfect Lighthouse run.
That’s why many site owners see glowing Lighthouse scores while Search Console insists their Core Web Vitals are failing. Here’s what’s really happening:
- Lab data tests ideal conditions; field data captures reality.
- Real users have slower devices and patchy connections.
- Distance matters – your server may be far from them.
- Third-party scripts act up under real load.
Search Console’s Core Web Vitals report shows what Google sees, not what you wish it did. Because field data updates over a 28-day window, your latest tweaks take time to register. That "fail" reflects your users’ last month, not today’s improvements.
Fix Performance Problems
How Does Caching Help WordPress Handle Traffic?
By default, WordPress builds every page dynamically using PHP and MySQL. Each new visitor triggers the same database queries and processing, even when nothing on the page has changed.
Caching fixes that by serving pre-built HTML files, cutting out all the heavy PHP and database work. Instead of rebuilding your homepage a thousand times for a thousand visitors, the server simply delivers one ready-made version to everyone.
The result? Hosting benchmarks show that caching significantly slashes server load , letting your site handle more concurrent visitors. So when a post goes viral or a sale floods your site, caching keeps it running smoothly instead of crashing under the pressure.
CDNs take it further by serving cached copies from servers near your users – Sydney for Australians, not Chicago. That shortens delivery time and eases the strain on your origin server, even when traffic surges into the thousands.
The Four Layers of Caching
Edge (CDN) serves static files from data centers near each visitor. Images, CSS, and JavaScript load from the nearest location, cutting geographic latency.
Page (Server) stores complete HTML on your web server. When someone requests your homepage, they receive pre-generated HTML instead of waiting for WordPress to build it. You can test this layer's effectiveness with a test tool.
Object (Application) caches database query results in memory. Complex queries run once, then serve from RAM for subsequent requests – critical for dynamic pages that can't use full-page caching.
Browser (Client) stores files on visitor devices for return visits. Returning customers load cached CSS and images instantly without any server requests.
Each layer reduces work for the layer beneath it. CDN caching prevents requests from reaching your server. Page caching eliminates PHP processing. Object caching minimizes database queries. Browser caching eliminates repeat downloads entirely.
What Stays Dynamic
Shopping carts and checkout pages have to be built fresh for every user – they hold personal details, payment forms, and constantly changing order info.
Account dashboards and logged-in views skip page caching to stay secure and personal. Anything behind a login – member areas, profiles, private messages – needs to load in real time.
E-commerce and membership sites lean on object caching to keep dynamic content fast. Product pages can use full-page caching, but cart widgets and "Recently viewed" sections rely on object caching to update without rebuilding the whole page.
Marketing pages, blog posts, and public product listings work great with full-page caching. These usually make up the majority of a site’s traffic – so start your caching efforts here for the biggest performance win.
What WordPress Optimizations Matter Most for Scaling Beyond Hosting?
- Page caching reduces server load more than any other single change. A properly cached WordPress site serves static HTML to most of your visitors, eliminating PHP and database overhead entirely. Image optimization cuts bandwidth usage.
- Compress existing images and serve them in modern formats to reduce transfer costs and improve loading speed.
- Object caching speeds up database-heavy pages that can't use page cache. Dynamic content like carts and user dashboards still need optimization – Redis or Memcached provides it.
- CDN offloads traffic from your origin server. Distribute static assets globally to handle geographic load and reduce origin bandwidth consumption.
- Reduce plugin database queries on every page load. Audit plugins and remove those making unnecessary database calls on public pages.
These five changes let you scale without touching the hosting infrastructure. Most sites see dramatic improvements from just the first three optimizations.
Do I Need a CDN for WordPress?
A CDN stores copies of your site on servers around the world, serving each visitor from the location closest to them. The result is faster load times, often significantly quicker for international users, and a lower TTFB thanks to cached HTML being delivered from edge locations instead of your main server.
Before you invest, check your analytics. If more than 20% of your traffic comes from outside your hosting region, a CDN is worth it. A site hosted in New York with plenty of European visitors, for instance, definitely needs global distribution.
For most WordPress sites, Cloudflare’s free tier does the job beautifully. Paid plans make sense only if your site moves serious bandwidth or needs extra bells and whistles.
How Do I Optimize Images for WordPress Speed?
Images can make up more than half of a typical page’s total weight, which means that oversized hero images tanking your LCP needs attention.
Switching to WebP can slash file sizes massively compared to JPEGs with no noticeable drop in quality. It’s usually the quickest win for faster load times.
Use lossy compression to strip away detail that the human eye can’t see. You can shrink that 5MB product shot to around 200KB without anyone noticing.
Enable lazy loading so images below the fold only load when users scroll to them. On image-heavy pages, this alone can shave 1–2 seconds off your LCP.
- Some websites can compress automatically on upload.
- All three convert to WebP with fallbacks for older browsers.
- Each supports bulk optimization for existing media libraries.
What Is a Good TTFB for WordPress?
TTFB is the minimum possible load time for your site. It’s like your server saying "I'm working on it" before sending any content. Here’s how to assess it:
- Excellent: Under 200ms.
- Acceptable: 200-600ms.
- Fix immediately: Over 600ms.
Test TTFB using GTmetrix or WebPageTest to see your baseline. Run multiple tests since TTFB varies based on server load and caching status.
Slow TTFB comes from shared hosting limitations, inefficient database queries, or missing caching layers. A 2-second TTFB means visitors wait 2 seconds before anything starts loading – unacceptable for modern sites.
Enable PHP OPcache if your host hasn't already (most quality hosts enable this by default). OPcache stores compiled PHP code in memory, eliminating compilation time for each request. This single change often cuts TTFB significantly on dynamic sites.
Do Too Many Plugins Slow Down WordPress?
Plugin quality matters more than quantity. Five well-coded plugins outperform one bloated plugin, making dozens of database queries.
Install a tool to find plugins running slow database queries. This free tool reveals exactly which plugins hurt performance and where they waste resources.
Use a cleanup tool to disable plugin scripts on pages that don't need them. Your contact form plugin shouldn't load JavaScript on blog posts – Asset CleanUp prevents this waste.
Third-party scripts need special attention:
- Defer or async analytics, ads, and chat widgets to prevent render blocking.
- Move tracking to Google Tag Manager for better loading control.
For Elementor sites, enable "Improved Asset Loading" in Settings → Features. This reduces DOM size and eliminates redundant CSS – critical for Elementor's traditionally heavy output.
How Multidots Can Help
When diagnosis reveals complex bottlenecks or you're facing revenue-critical performance requirements, Multidots' 15+ years of enterprise WordPress expertise delivers the engineering depth your project needs. We take sluggish, problem-ridden sites and turn them into lightning-fast platforms built to handle millions of visitors – calmly, consistently, and without breaking a sweat.
Performance Audits and Analysis
Our performance audit gives you a ranked action plan of fixes by real impact on Core Web Vitals. You don’t have to deal with fluff or guesswork – we give you data that actually moves the needle.
We run deep tests across multiple tools, break down exactly why each issue matters, and hand you a clear, sequenced roadmap. You’ll know which optimizations deliver instant wins and which call for deeper structural work.
This includes:
- Bottleneck identification with root-cause analysis.
- Priority matrix balancing effort and impact.
- Specific code examples and configuration tweaks.
- Projected performance gains for every fix.
Timeline: 1–2 weeks from kickoff – ready in time for your next sprint planning.
Custom Development
Generic plugins often drag in unnecessary features and conflict with each other, killing speed. Our custom builds cut that noise completely.
We code to WordPress VIP standards – the same best practices powering enterprise platforms that see billions of pageviews. Every query, script, and line of code earns its place.
Our custom solutions include:
- Streamlined alternatives to heavy plugins.
- Performance-first architecture from the start.
- Query optimization for complex data demands.
- Seamless system integrations with zero bloat.
Timeline: 4–8 weeks, depending on scope. We’ll define milestones during discovery for full visibility on deliverables and deadlines.
Managed Maintenance
Left unchecked, performance naturally drifts. Our Managed Maintenance service keeps your site in peak shape with proactive monitoring and continuous tuning.
We offer custom SLAs for uptime and performance targets, fixing Core Web Vitals slippage or new bottlenecks before they dent your metrics.
Monthly services include:
- Real-time monitoring and instant alerts.
- Pre-emptive optimizations as content scales.
- Tested updates for plugins and themes.
- Monthly reports packed with insights and next steps.
Timeline: Ongoing monthly retainer with flexible terms.
Prioritize Optimization
Performance is all about identifying the bottleneck before you touch a single setting. Running PageSpeed Insights takes two minutes; guessing which plugin to install can burn hours (and usually make things slower).
Start with the easy wins that move the needle fast:
- Compressing images can shrink page weight by up to 70% in minutes.
- A well-tuned caching plugin cuts server strain right away.
- Setting up a CDN takes an afternoon but speeds up access for visitors everywhere.
These weekend-level fixes handle most performance hiccups. But for high-traffic sites, you’ll need solid infrastructure to keep Core Web Vitals in check when demand surges. When thousands hit your site at once, or when complex processes need to stay lightning-fast, architecture – not settings – is what makes the difference.
What happens next depends on what you find. If it’s a simple bottleneck, follow the fixes in this guide. If it’s complex or mission-critical, book a Multidots performance audit for a tailored roadmap in just two weeks.
Ready to accelerate your WordPress site? Schedule your performance audit with Multidots today.
Schedule a meeting to discuss the potential of your website and how you can turbocharge it!
Contact Us