How to Check Your WordPress Website’s Performance
Learn key techniques to evaluate your WordPress website’s performance and implement improvements for optimal speed

Table of Contents
As of 2021, WordPress now powers about 42% of the websites on the Internet.
In fact, with a 61.8% market share, WordPress has become the most widely used CMS in the world. With that kind of popularity, there is little doubt about the performance and success that it delivers for its clients.
But the journey of running a successful website goes far beyond having a winning CMS solution or hosting provider. It has a lot to do with periodic monitoring and checks, which can enable regular customer-centric optimization of the website.
WordPress offers plenty of plugins and integrations that users of various backgrounds can easily use. The WordPress community has thousands of contributors who participate in active events and in creating plugins and modules. Despite that, your website can face issues such as lags or glitches, which can be resolved with regular performance monitoring and management.
This guide will take you through the process of maintaining your WordPress website’s performance and the various aspects that you should consider in the process.
Why You Need to Measure Your WordPress Website’s Performance
Your website performance directly impacts the returns that you can expect out of it. WordPress or not, your website will need regular maintenance and upkeep to deliver a superior user experience. Doing so can make your website stand out from the rest, and reaffirm your brand value and perception in the customers’ minds.
Needless to say, people dislike using sluggish websites and expect enterprises to consistently upgrade the quality. If not, some of the major issues, you will face are:
- Lower Conversion Rate: If customers browse your website and find it laggy or unuseful, it is likely to affect their perception of your brand and prevent actual conversions.
- Higher Bounce Rate: If your website takes too long to load, it can translate into higher bounce rates, highlighting the need for constant optimization of your website speed
While WordPress makes it fairly easy to manage your website and flags potential issues regularly, it is important to run a maintenance check at least twice a month to ensure a seamless browsing experience for your customers. Tracking your Core Web Vitals and regularly tweaking your website experience based on it, can help you drive better performance out of it.
Understanding the User-Centric Performance Metrics of your WordPress Site
Over the years, website performance has come to the forefront of digital marketing efforts for brands across the globe. The reason is simple: the user experience that you deliver on your website can make or break your case — especially if you want to rank better on Google.
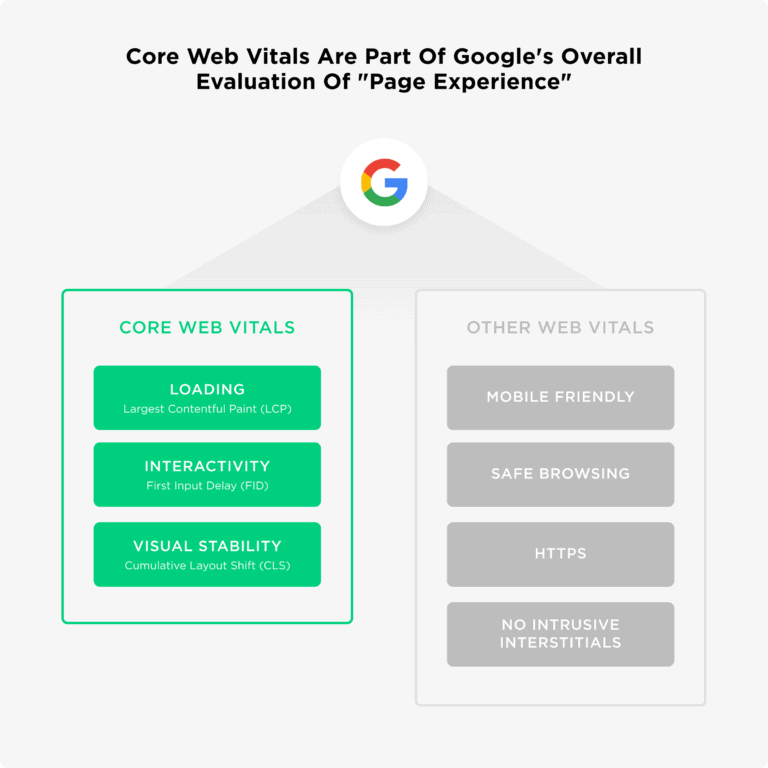
Core Web Vitals are metrics that measure the overall web user experience of your webpage, and these play a part in determining the performance delivered by your website. And WordPress makes it easy for you to manage these metrics and more.
First Contentful Paint (FCP)
In 2019, Google announced that the website’s speed ranking will depend heavily on its FCP. Since then, it has evolved to make up for about 10% of the overall performance score of websites.
First Contentful Paint or FCP marks the perceived loading speed of pages. Essentially, this means that if a speed test suggests that your page load speed is 2 seconds, but if the 75th percentile of your users does not experience that speed, you will incur a penalty from Google.
Be careful to not confuse First Contentful Paint with First Paint, as the latter refers to the specific point in the page load timeline wherein the first render is displayed on the screen. The ideal FCP occurs within 1.8 seconds or less, and if it exceeds more than 3 seconds, then your website is considered to be slow.
You can improve your FCP by reducing your server response time, choosing a better hosting provider, and eliminating your render-blocking resources.
Largest Contentful Paint (LCP)
Largest Contentful Paint or LCP is a measure of how fast the main element of your website is displayed and interacted with. For this metric, the largest content block or image within the user’s viewport is considered. So elements that are outside the scope of your screen are not counted.
Usually, the elements that are considered in this regard include video poster images, paragraph tags, and background images. It is considered to be one of the Core Web Vitals because it determines how fast a website is displayed. LCP is also set to become a ranking factor in 2021, making it even more important for enterprises to focus on the metric.

Some of the primary areas that you want to improve to boost your LCP score are load times for slow resources, slow servers, and render-blocking CSS or JavaScript codes.
Remember: An easy way to go about optimizing your LCP is by tweaking it for your mobile viewport before the desktop viewport.
Total Blocking Time (TBT)
Total Blocking Time or TBT is the main metric that is used to determine load responsiveness. It is defined as the amount of time between the First Contentful Paint (FCP) and Time to Interactive (TTI).
In essence, the TBT of a website quantifies how much non-responsive time exists after the page loads and before the user can make any inputs or interactions on a page. This non-responsive time is caused as the main thread is blocked to prevent users from making any inputs.
The "main thread" is considered blocked when a Long Task is still running. Since browsers can not interrupt a running task, ones that take more than 50 ms are designated as long tasks. If a browser tries to register an input while the Long Task is still running, they must wait till the task is completed, for the page to be responsive.
In any case, if your page loads and remains unresponsive for more than 50 milliseconds, users are more likely to perceive your website as clunky or sluggish. Considering these parameters, enterprises should strive to keep their TBT in check and under 300 milliseconds.
Some of the common ways to improve the TBT are reducing the impact of the third-party code, optimizing the number of request counts and transfer sizes, and minimizing the execution time for your JavaScript Code.
Cumulative Layout Shift (CLS)
Cumulative Layout Shift or CLS is an important user-centric metric that can help you determine the visual stability of a webpage. It measures how often the layout of the webpage shifts, which can essentially impact the user experience. A lower CLS score translates into a highly delightful user experience.
A layout shift is defined by the moving of visual elements from one place to another within the webpage. This challenge is more common than you think as it takes place when a third-part element that dynamically resizes itself is introduced onto the webpage, or if new DOM elements are added to a webpage with existing content blocks.
The ideal CLS score should be less than 0.1, and the right way to measure is to test it in the 75th percentile of your users across mobile and desktop browsers. The problem with a higher CLS score is that it can make it difficult for users to take actions that they want to take on the website, resulting in an unsatisfactory user experience.
To avoid a higher CLS score, you can take proactive measures like avoiding adding content to an existing content block on the webpage unless it is in response to user input. You must also avoid animating properties that can trigger layout changes.
First Input Delay (FID)
Another important Core Web Vital that you should be monitoring is First Input Delay or FID. It measures the amount of time taken by the website to respond to the first user input.
When a user lands on a webpage and clicks a link or button on it, they expect to receive an immediate response. However, more often than not, users do not receive any response for a while — we have all been there. And of course, it negatively impacts the user experience.

The ideal FID score is less than 100 milliseconds, and if it is between 100-300 milliseconds, it needs improvement. Anything above 300 milliseconds is considered poor. You are likely to have a higher FID score if you have chosen a heavy WordPress theme for your website.
In any case, you can improve your FID performance by breaking up long tasks, readying your page for interactions, and reducing the execution time of your JavaScript code.
Time to Interactive (TTI)
Time to Interactive or TTI is used to measure the time it takes for a webpage to allow users to interact with it. Needless to say, the ideal interaction times should be such that when the user attempts to take any action on the webpage, the response should seem instantaneous to them.
If the lag is longer, the users are likely to perceive it as a website issue. The ideal TTI is lower than 100 ms, but the score is flexible based on the type of webpage. So, while a landing page with a web form for users should not take much time to be interactive, a blog page can be less interactive.
Calculating the TTI for a webpage can get quite tricky as there is no predefined point at which a webpage should be ready for interaction. You need to monitor the main thread as well as the network activity using tools like Lighthouse to extract insights on improving this metric.
Just like other metrics that have been discussed so far, improving Time to Interactive (TTI) has a lot to do with optimizing the JavaScript code. More importantly, the optimization should be done for mobile and desktop devices.
6 Website Performance Factors to Test
To be able to deliver an optimal website experience, enterprises have to constantly test and monitor the website performance factors. By paying attention to these factors and accordingly optimizing the website, enterprises can ensure a superior user experience that is linked with higher conversion rates.
Initial Page Speed
Slow websites need to be up to speed quite literally nowadays considering the huge amount of data and information that is integrated into them today. Constant speed optimization and revamp are required for the websites to perform well.
A higher initial page speed ensures that the users do not lose patience even if the heavy elements on your website such as graphics or videos take time to load. To monitor the initial page speed, you can perform ping requests from your website server or measure the Time To First Byte (TTFB) periodically.
Full Page Load Time
One of the proven ways to step up the user-centric website experience is having your webpage rendered on the browser in the minimal time possible. In this regard, it is important to monitor the time taken for webpages to fully load on the browser after user prompts.
For growing enterprises, this indicator is important because it shows how your website performs as it scales up. Using this metric, website managers can make decisions such as caching static content on various locations such as Content Delivery Networks (CDN), thus freeing up the backend servers to load the dynamic content seamlessly.
Geographic Performance
If you are operating an online business or a global enterprise, you will need a website that performs consistently well across various global locations. Every organization aims to increase its global reach through its websites but client-server communication can place significant limitations on the website performance.
Several factors such as bandwidth, accessibility to technology, and government policies can impact website performance. To ensure that your website performance and speed are consistent across locations, it is a good idea to run regular website speed and availability tests.
Load Tolerance
It comes as no surprise that web traffic influences website performance significantly. Certain hosting servers may break down in performance during excessive loads they are used to managing a negligible amount of load.
To prevent this, regular stress tests, load tests, ramp tests, and performance tests on the website should be conducted. Such tests can determine the extent of traffic the website can handle before going down completely. If you find that your website is not equipped to handle peak traffic, consider getting a hardware upgrade.
Web Server CPU Load
Even the most well-designed websites with clean and speed-focused code can underperform if they are rendered by a shared hosting provider. Hosting providers and companies can often face issues in keeping the website performing smoothly during peak times if the server computing power is unable to process the website download.
Monitoring the CPU load of the servers can help in keeping a check on whether the hardware of related infrastructure can handle peak web traffic.
Website Database Performance
For dynamic content to be easily accessible from back-end databases, maintaining database performance is critical. Inaccurate data transmission can be both — counterproductive and detrimental to your website performance and user experience. So there should be a mechanism in place for handling such risks.
Checking periodically for free disk space on servers can help in managing data losses as well as potential errors that might otherwise impact the website’s performance. This can also help in handling broken links which can degrade the performance of the website.
Top Tools to Test WordPress Performance and Site Speed
One of the aspects that you should realize right away is that website performance can be monitored using multiple tools. You do not necessarily have to pick one specific tool for everything.
PageSpeed Insights
PageSpeed Insights (PSI) by Google is a free tool that helps you identify issues and optimize your website performance. It generates reports on mobile and desktop performance and provides suggestions on how these areas can be improved.
It is easy to use and offers insights on the Core Web Vitals, as well as provides Performance Scores based on field and lab data. A performance score above 90 is considered to be ideal, a score between 50-90 is considered moderate, and a score below 50 is considered poor.
With a clean interface, detailed reports, and explanations, PageSpeed Insights is a preferred tool for beginners. And of course, the accuracy is unquestionable considering it is presented by Google.
GTMetrix
GTMetrix is another free tool that is accessible for webmasters and IT managers to monitor website performance. Like PSI, GTMetrix too offers insights on Core Web Vitals, and offers features such as scheduled monitoring, and alerts when the page is performing poorly.
The tool can be used easily on desktop as well as mobile devices and uses Google Lighthouse for the analysis. Going a step further, GTMetrix offers advanced analysis options such as changing screen resolution to test responsiveness and editing user agents or adding DNS for development environments. You can also create presets/shortcuts for options that are used by you frequently.
Other additional features offered by GTMetrix include Adblock Plus to test page load times, API functionality, URL Filtering, Cookie Sessions, HTTPS Authentication, and Connection Throttling.
Pingdom
Pingdom is known for its ability to monitor and generate reports on the uptime and performance of your website. More specifically, it analyses the page loading and website speed which is a vital part of the overall user experience.
Pingdom generates an overall performance grade, and then individual grades for each aspect that plays a role in defining the website performance. It is a great tool for identifying the primary bottlenecks that may not be very apparent. What’s more, you get insights on metrics such as the total page size, total load time, and the number of requests on the website.
Pingdom allows companies to take a free speed test, which offers insights on most Core Web Vitals. However, to enjoy the complete suite of services such as scheduled monitoring and reports, enterprises can opt for the premium version.
Which Tool to Pick When
While we have listed three of the most popular and preferred tools, there is a plethora of such tools — free and premium, that you can explore. And as we stated earlier, using a combination of multiple tools that serve different purposes is always an option so you do not have to find a one-size-fits-all tool for your website.
GTMetrix offers a free basic plan wherein you can monitor three URLs, and if for bigger websites or agencies, there are premium plans starting from $14.99 per month. On the other hand, PageSpeed Insights is completely free for use. Since Pingdom offers a lot more features than the other two, their website monitoring suite plan starts from $42.99 per month.
While GTMetrix and PageSpeed Insights offer options to check your website from mobile devices as well as desktop browsers, Pingdom does not support testing from mobile phones. Additionally, GTMetrix and Pingdom let you select locations to test your website whereas PageSpeed Insights does not.
PageSpeed Insights is a great tool for non-technical website managers who are looking for a tool to monitor and enhance the performance of their websites. It includes mobile and desktop analysis and offers actionable recommendations based on your score. So if you want to run a quick speed check for your web pages, PSI is the way to go.
However, if you are looking for additional features such as geographical performance monitoring, and uptime monitoring, then Pingdom is the tool that you should go for — especially if you have an enterprise-grade website. The tool is also great for businesses that need a personalized suite of services.
On the other hand, GTMetrix is a great tool for businesses that are looking for a comprehensive analysis of their website performance, however, do not need personalized services such as alerts or real-time monitoring of the website.
Sample WordPress Performance Test
To give you a better understanding of the capabilities and insights that the aforementioned tools offer, we want to show you how to run a speed test and interpret the results. For this example, we would be considering two tools — Pingdom and PageSpeed Insights.
Ready? Let’s go.
Pingdom
We start by going to the official website and opting to take a Pingdom Website Speed Test. You have two dialog boxes here — URL and Test Location. We selected ‘North America - USA - San Francisco’ for the test.

Once you enter the inputs and start the test, the website only takes a couple of minutes to come up with a detailed report. First, Pingdom presents a summarized report with the overall score for the analyzed URL.
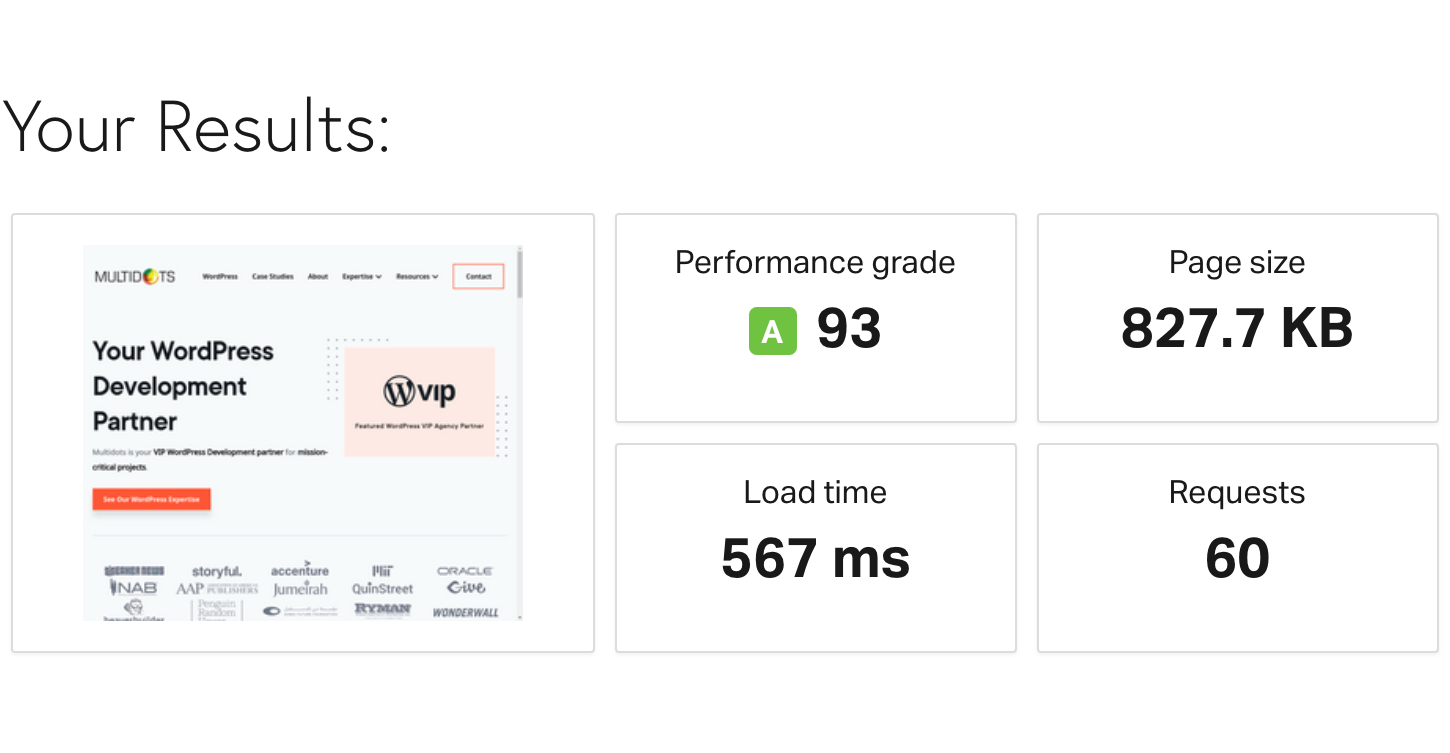
In this case, Pingdom has assigned an A Grade to the URL with a score of 93. The results also show the page size, load time, and the number of requests that the tool sent. These insights are common across all tools, although the performance grade or score can slightly differ.
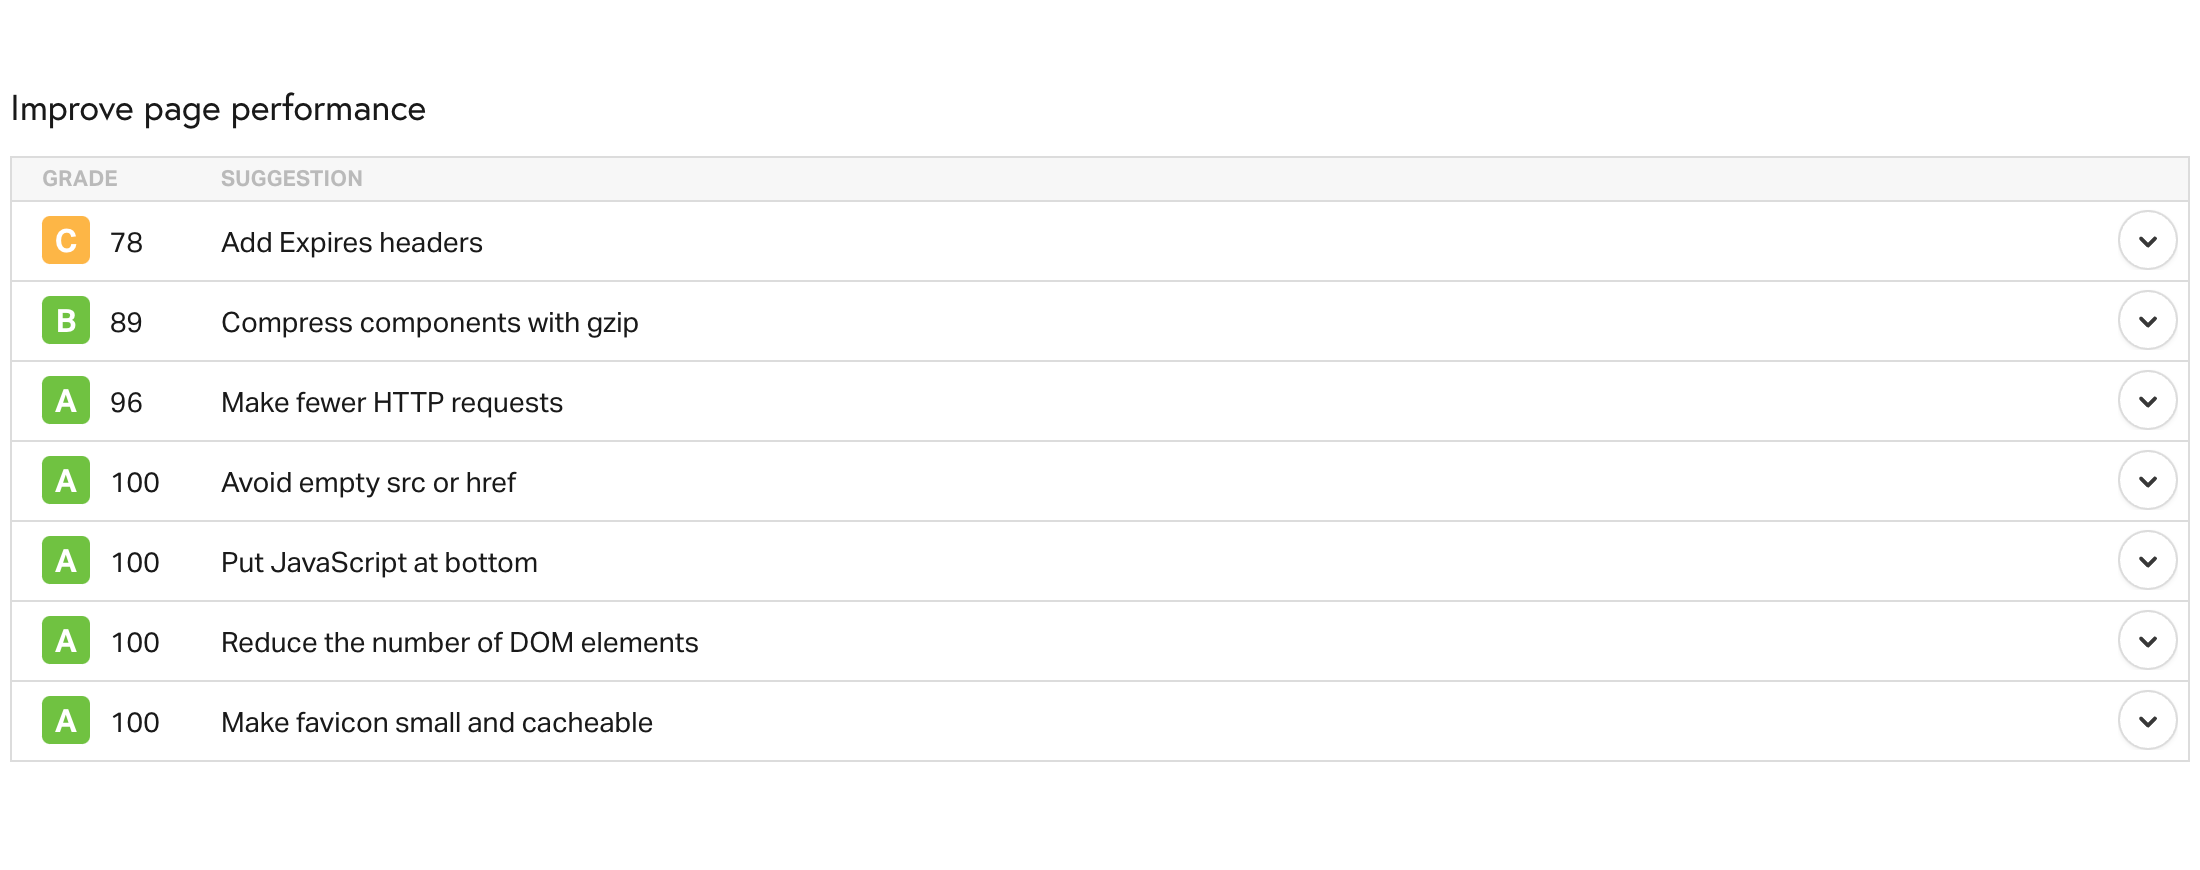
Next, the tool presents a list of individual scores for various areas that you should focus on. It highlights the strong points and the weak ones so that you can divert your efforts to the ones that require extensive improvement.
As discussed before, you should be open to testing with multiple tools to run a comprehensive check on your website performance. So to seek insights on Core Web Vitals, the next tool that we will test is PageSpeed Insights (PSI).
Google PageSpeed Insights
We start by visiting the official PageSpeed Insights page by Google Developers. The interface is simple and uncomplicated to understand with a single dialog box to enter the URL that you are testing.

As soon as you click on ‘Analyze’, the tool uses Lighthouse to come up with a detailed breakdown of how your Core Web Vitals are performing.
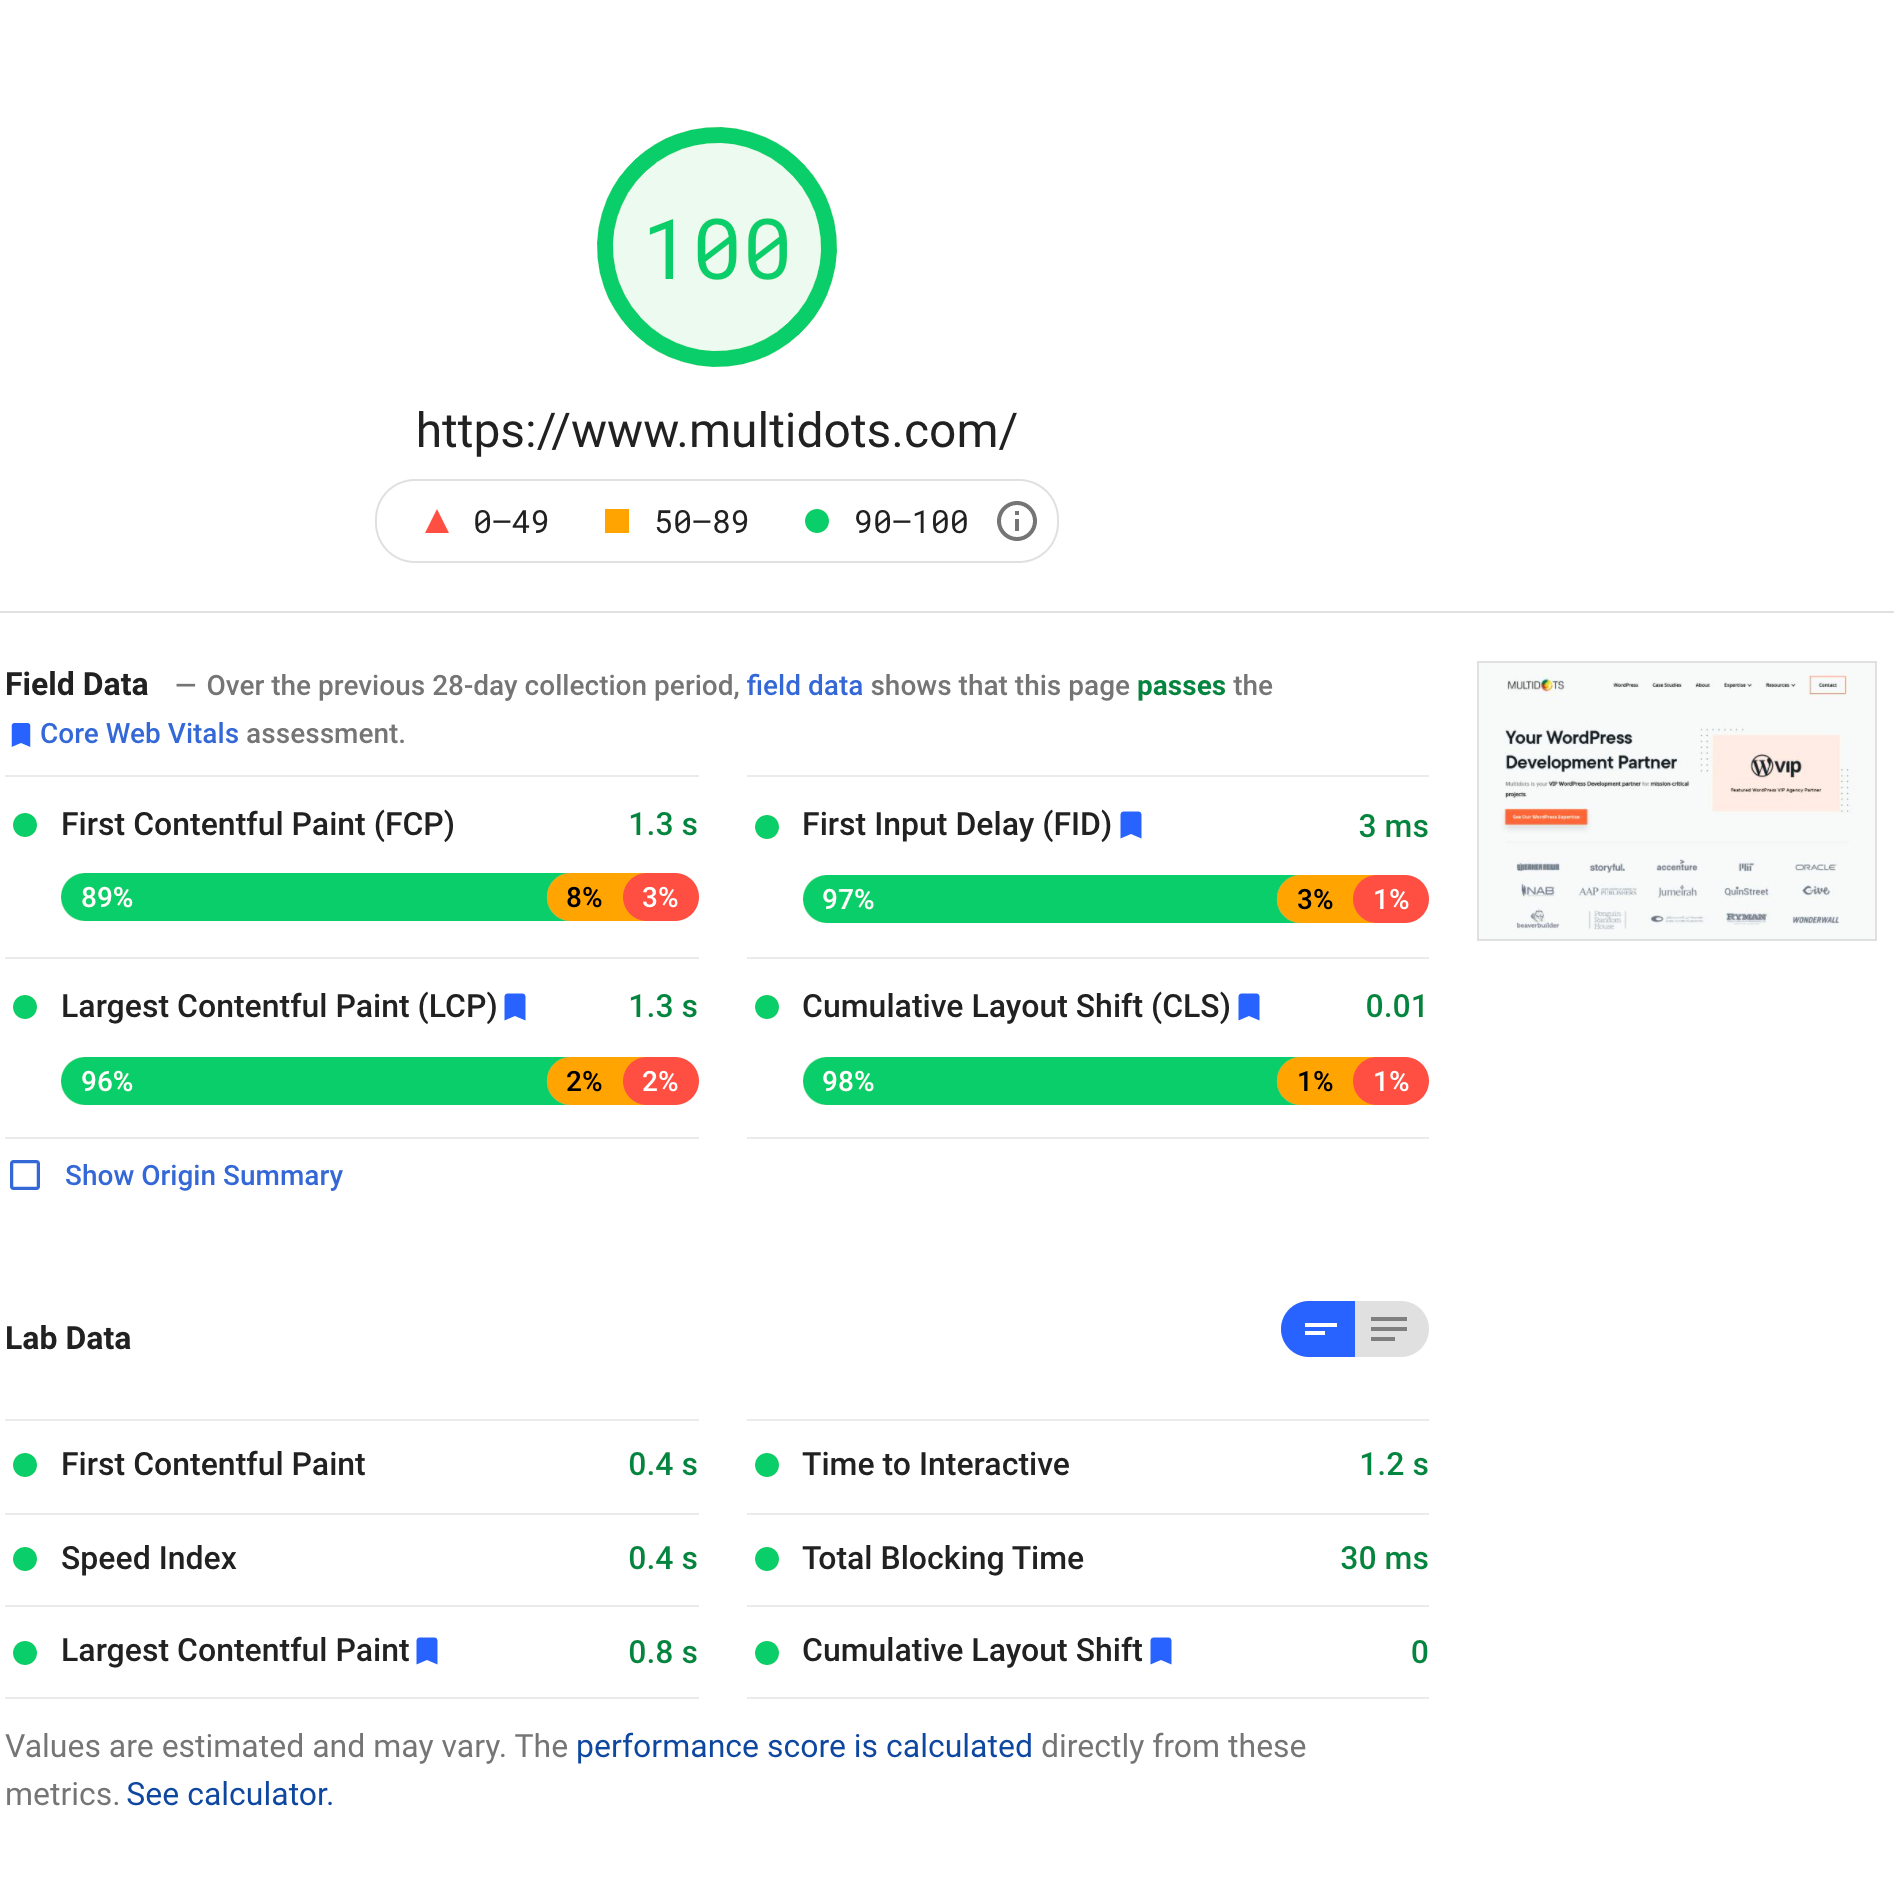
Right away, you can see that there are two tabs on the top — Mobile and Desktop, where you can choose the device that you want insights for. We will look at the Desktop results in this example, where the overall performance score is 99.
Additionally, individual scores have been assigned to all the Core Web Vitals. The field results have been presented based on the experience of real users, and the lab results are generated based on the lab data. You also have the option of viewing your results in the form of a Treemap. You can toggle to the ‘Mobile’ option for similar insights on your website performance on mobile devices.
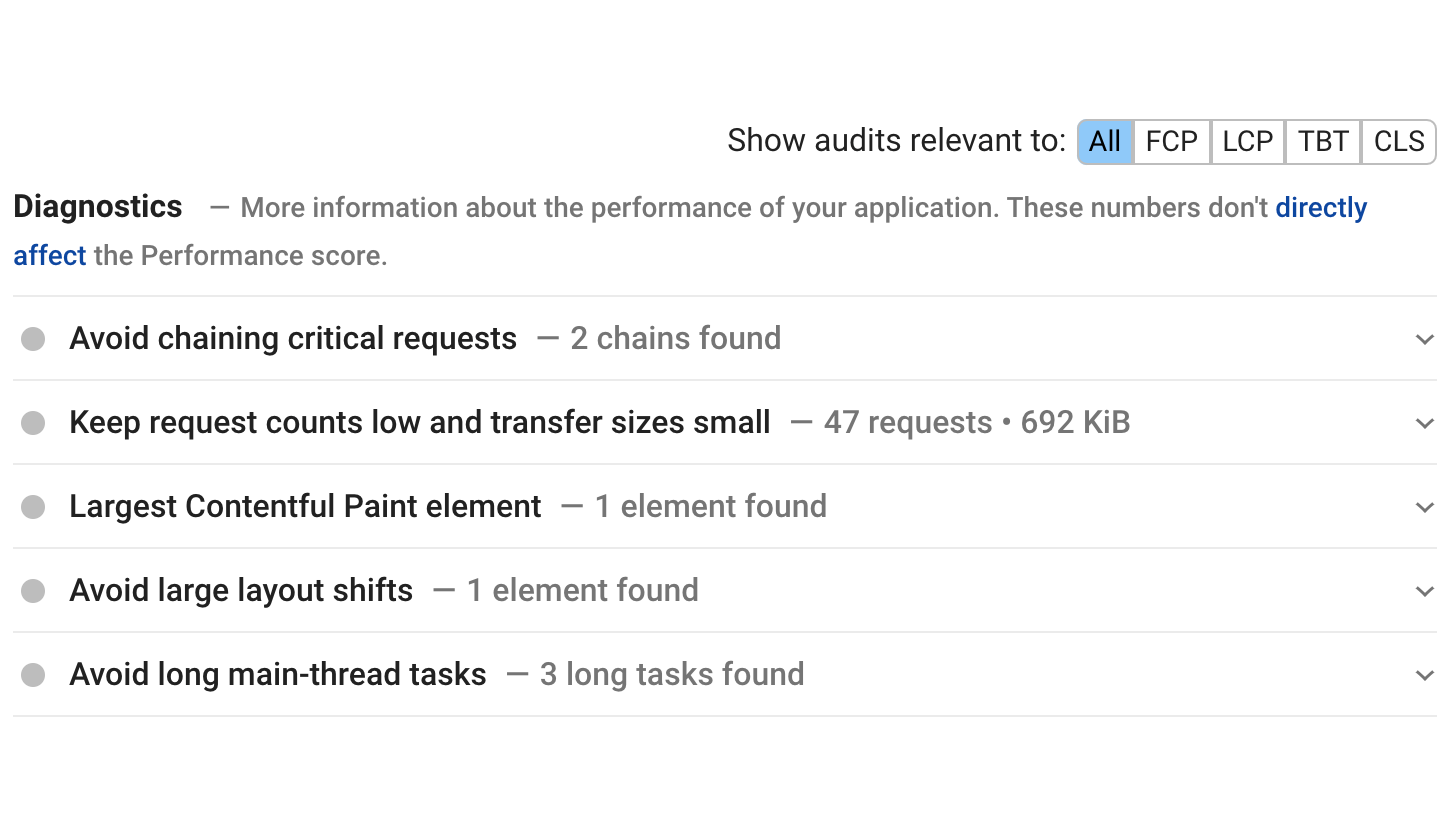
Based on the analysis of your website speed and performance, PSI offers detailed diagnostics on the areas that require improvement. These diagnostics are supported with actionable recommendations that can be used to improve your performance score.
Tips to Fix Speed and Performance Issues
Now that you know what Core Web Vitals are, and how you can monitor them for optimizing your website performance, you can truly benefit from knowing some of the easy fixes that can help you in the process. We recommend the following things to help the performance of your website up to speed:
Implement Caching
Think of caching, as the short-term memory of your website. When the user visits your website for the first time, all the pages accessed by them are stored in the cache memory, so that the next time they visit your website, these pages are displayed seamlessly. Essentially, this avoids the need for your website to fetch web pages from the server every time the user requests them.
Thus, caching can reduce the load on your server, and make the browsing experience lag-free and fast for users. WordPress offers plugins such as WP SuperCache, WP Rocket, and W3 Total Cache for you to integrate seamlessly into your website.
Remember: Caching essentially displays static versions of your webpage, so if your website has a lot of dynamic elements and content, implementing it can be counterproductive.
Optimize Database
In the spirit of speeding things up for your website, another area that you can declutter is — your database. Optimizing your database includes reorganizing them in a way that you can save space and improve your backend efficiency.
By cleaning up your databases, you will free up space for more data, and increase your overall website speed and performance on the side. Before you wonder how, of course, there is a WordPress plugin for that.
WP - DBManager is a great plugin for optimizing your databases as it will help you delete or repair unused databases, and optimize them for maximum efficiency. You can also use WP-Optimize for cleaning up your databases and optimizing them.
Compress Images
Images are some of the heaviest elements that you are likely to have on your website. If your business relies on these images for conversions, they are going to be even more important for your performance. But unfortunately, having a large number of images can significantly slow down your website.
Enter image optimization. With this process, you can reduce the size of your images considerably without affecting the overall quality of the image. Since large images can affect the bandwidth usage and thus your user experience adversely, optimization can be quite important.
What’s more, you can automate this process, by using plugins such as ShortPixel, which can help optimize images before uploading them.
Use CDN
Having a global content repository that enables you to store content on multiple servers across the world does not sound that bad, does it?
Using a Content Delivery Network or CDN can ensure that your users can access your website content effortlessly, regardless of where they are located. CDN is basically a globally wide network of proxy servers and data centers that allows you to store your content so that you can enable higher availability and delivery.
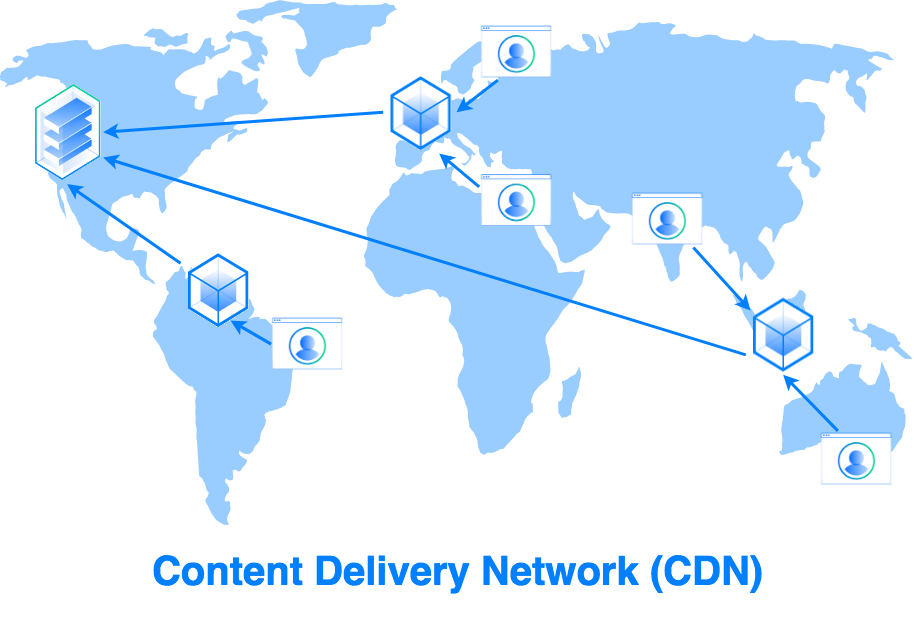
By reducing the physical distance between the servers and users, you can make the browsing experience faster and minimize delays while displaying high-quality content. You can integrate highly reputed WordPress plugins such as Cloudflare and Jetpack for achieving this.
Wrapping Up
If you have WordPress powering your enterprise website, you are already on the right path in terms of scalability and performance. Monitoring the speed and performance of your website can seem like a daunting task at the outset, but with the right know-how and tools, you can practically get your website to manage itself. For extra support, WordPress has thousands of free and premium plugins that you can integrate within your website so that it is always optimized and ready to go.
If you think you need an extra hand with the optimization of your WordPress website, hire one of our WordPress developers to smoothen the process.
Schedule a meeting to discuss the potential of your website and how you can turbocharge it!
Contact Us